Reply to: "Normalizing SASsy Data Using Log Transformations"
by a sassy statistician
The statistician Frank J. Anscombe said about data analysis that one should "[...] make both calculations and graphs. Both sorts of output should be studied; each will contribute to understanding."
This is wise advice that must not be ignored by the practicing data analyst or statistician.
In 37:4, Chris Rucker wrote an article describing how logarithmic transformation was a panacea to a so-called problem of "non- Normal" data.
Unfortunately, that article was both misleading and suffers from fundamental misunderstandings about the underlying mathematics and utility of such transformations.
To create a common starting point, the logarithm function is the inverse of the exponential function.
When data is log-transformed, large values are pulled towards the center and vice versa. Importantly, log and exponential transformations are monotonic, preserving the rank ordering of the original data. They cannot magically create normal data from non-normal data. This means that, to the degree that there is variation (so-called "noise"), it persists on the transformed scale, and skewed data remain skewed.
Exploratory data analysis is a process by which statisticians or data analysts come to understand the contents of a dataset, the meaning of each variable, their distributions, and their relationships prior to undertaking more substantive analyses.
Chris Rucker offers that a "[...] best practice before performing an exploratory data analysis is to normalize your data so that it is somewhat symmetrical [...]".
It is a common misconception that data need to be made "normal" or symmetric in order to perform statistical analyses, yet this is frequently not required. He continues that "[...] approximately 68 percent of data falls within one standard deviation of the mean when transformed." It is true that with a normal distribution, 68 percent of the data are within one standard deviation of the mean. However, all bets are off once a transformation is applied.
There is a more fundamental misunderstanding that is caused by rote transformation of a variable, and is that the meaning of that variable in its original units or scale is ignored.
At worst, it may be lost entirely. To use the same well- known "cars" dataset, Rucker log-transformed the "cylinders" variable, which records the number of engine cylinders for each car. A cursory knowledge of internal combustion engines is enough to know that a typical car has four or six cylinders, usually in even numbers, and seldom fewer than four or more than eight.
One could also observe this from a tabulation of "cylinders" (no graphs required!). Data in the "raw" scale are meaningful when there are meaningful units.
In this example, the count of cylinders means something about the engine's design, its performance, or efficiency, all of which can be examined during exploratory data analysis.
In contrast, log-transformation completely obfuscates any substantive meaning.
Is the value of "0.60206 (= logl0(4))" cylinders meaningful?
Finally I come to the last issue: garbage in leads to garbage out.
Specifically, log-cylinders were plotted against car make in an attempt to show the apparent normality of the transformed data. These data were plotted in an arbitrary and careless way, resulting in an incorrect conclusion. A better way to show apparent normality would have been to use a histogram of cylinder or log-cylinder with an overlaid density curve.
Looking at the present Figure 1 , the data did not start normal, and log-transformation did not change this. In Rucker's figure, a line plot showing log-cylinders against car make sorted in alphabetical order was shown with a random ellipse over the middle of the data.
The choice of line plot is bizarre, as there is nothing natural or useful about alphabetically sorting car make, and implying a relationship among adjacent car makes and cylinders.
The ellipse and confidence interval have no relevance to the discussion of normality and transformations, so would have best been excluded, nor does the ellipse represent said confidence interval.
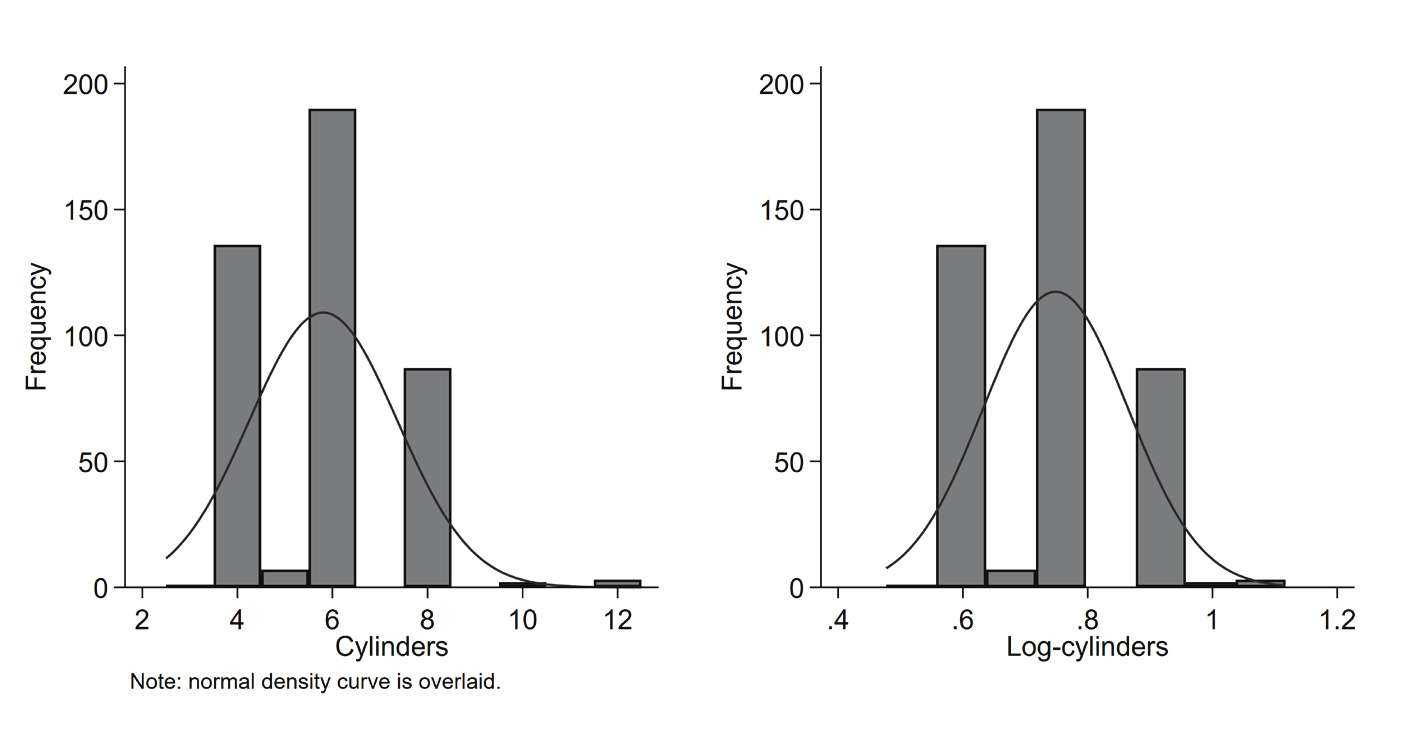
Figure 1: Histogram of cylinders and log-cylinders with overlaid normal density curve.