Citizen Engineer
"Display the Planet" is the New "Hack the Planet"
by ladyada@alum.mit.edu and fill@2600 .com
Welcome to the year 2019, where more energy is being used to mine Bitcoins than all the solar power generated.
In addition to the planet melting down or constantly on fire, there are a few other problems that relate to the weather and air quality that have come up recently.
Yahoo!, which is now owned by Oath (a Verizon subsidiary), shut down their weather service for developers. As of January 3, 2019, the weather.yahooapis.com and query.yahooapis.com URLs for the Yahoo! Weather API were retired, a first for sunsetting websites containing sunset times.
Perhaps they realized we no longer have weather, and are now spending time with family or something. This means if you made your own weather apps you need to find another provider.
Weather Underground was supposed to be the alternative for communities that wanted to share weather data - they let anyone set up a weather station to upload data - and was a service a lot of us used.
However, as of May 2018, free keys are no longer available for the Weather Underground API.
Weather.com (a.k.a. "The Weather Company") bought Weather Underground.
And IBM happens to own The Weather Company (ibm.com/weather). So yes, IBM now owns the weather, and pushed all the data hackers out. Say this out loud around fellow hackers and see the response: "Do you trust IBM with the weather?"
Open APIs (like Yahoo! and Weather Underground used to have) allow us to freely use the data from the Internet of Things (IoT) to create useful interactive devices.
Especially for the modern world with common extreme weather like hurricanes, floods, statewide fires, and industrial city air quality, knowing the weather is more than "Do I need an umbrella today?"
Ironically, a case could be made that all of us paid for these weather and environmental sensors and services over the decades - the data is almost all government-sourced. IBM doesn't have weather stations around the country; they use the federal and state government weather reports and satellite images. Since we paid for it communally, we should have some free access to the data.
Ironically, giving a simple text-only data endpoint for users to query would cost less than the service cost of visiting the fancy websites. Going to a website just to check weather means ads, spam, pop-ups, newsletter signups, tracking, cookies, a page load that is larger than the entire source code of Doom. But that's the trick - the data that we ought to have access to is now monetized. Checking weather on your phone now includes a free trip to Facebook for your personal location data.
While it's possible to scrape weather.com to extract the data you want, it's total overkill when making a small embedded project. (Also, we've noticed a lot of websites are starting to have so much JavaScript, it's impossible to get data out unless you have a full Chromium engine.)
On our search for the next weather API, we found OpenWeatherMap (openweathermap.org).
You do need an API key, but it's free to sign up, and you get a generous 60 calls per minute. The API is nice and clean, with a REST URL that contains the API key and all options, no OAuth or bearer certificate - for example: samples.openweathermap.org/data/2.5/weather?q=NewYork will get back the weather via JavaScript Object Notation (JSON) syntax.
As an aside: thankfully, we've noticed almost all APIs nowadays are JSON rather than XML, which is a blessing for microcontrollers and other memory-constrained devices, thanks to the compact, well-defined grammar. Despite the name containing "JavaScript," there are easy to use parser libraries available for Arduino and Python.
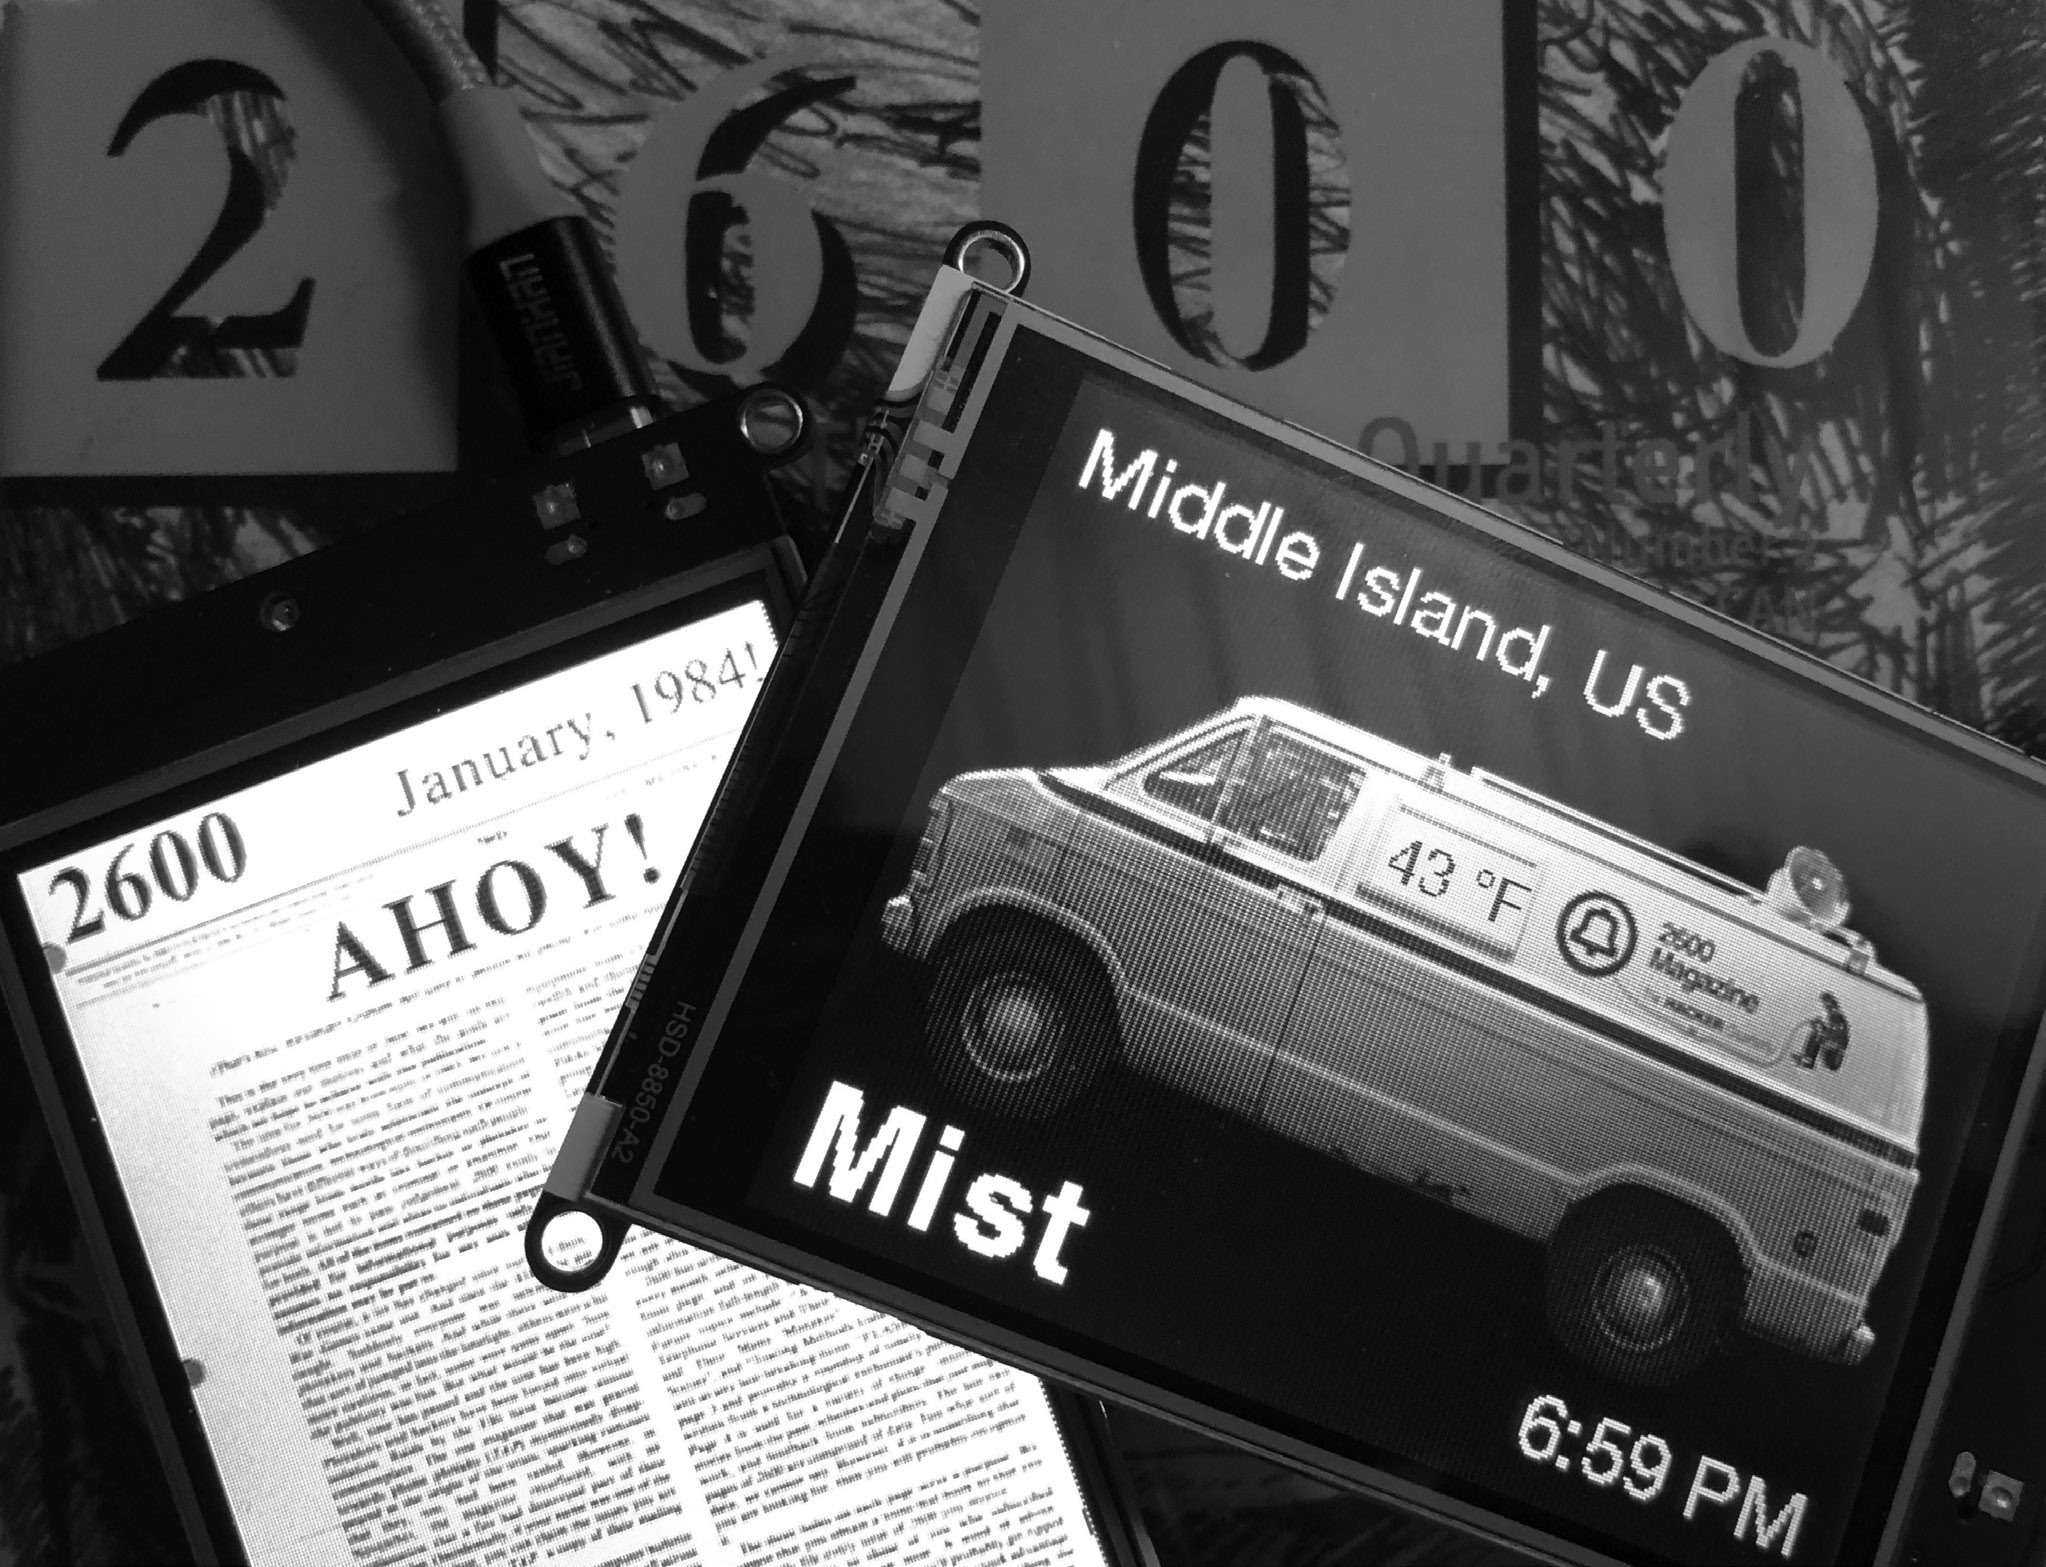
For our example, we're going to check in on the weather in Middle Island, New York 11953 (the home of 2600).
Once we've gotten the data, we're going to use Python to display it on a screen that sits on our desk. That's all it will do - no hidden microphone in the device like Google Nest, Amazon Alexa, or Apple Siri - just 100 percent open-source software, and a hardware device that we can inspect. And no open ports to listen on that can get hacked. Python is also a high enough level of abstraction that, when and if something changes, there will be another JSON API to use. (That's pretty much the only way to keep from going bonkers when designing with APIs - assume they will go away.)
Start by registering an account on OpenWeatherMap and get your API key.
You can test in your browser by querying the Middle Island ZIP Code. (Our key is removed, so put your key there):
https://api.openweathermap.org/data/2.5/weather?zip=11953,US&appid=YOUR-KEY-HERE |
In your browser window, you'll get back something like:
{
  "coord": {
    "lon": -72.94,
    "lat": 40.88
  },
  "weather": [
    {
      "id": 701,
      "main": "Mist",
      "description": "mist",
      "icon": "50d"
    },
    {
      "id": 741,
      "main": "Fog",
      "description": "fog",
      "icon": "50d"
    }
  ],
  "base": "stations",
  "main": {
    "temp": 279.55,
    "pressure": 995,
    "humidity": 87,
    "temp_min": 279.15,
    "temp_max": 280.15
  },
  "visibility": 1207,
  "wind": {
    "speed": 5.7,
    "deg": 240
  },
  "clouds": {
    "all": 90
  },
  "dt": 1551045780,
  "sys": {
    "type": 1,
    "id": 4128,
    "message": 0.0048,
    "country": "US",
    "sunrise": 1551007940,
    "sunset": 1551047875
  },
  "id": 420028625,
  "name": "Islip",
  "cod": 200
|
This is pretty human readable.
You can start to see where you'll get the names and values for what you'll want to display.
You can use desktop Python 3 to start extracting data. We assume you have Python 3 installed, and also have installed the "requests" library. Start by getting the data from online:
>>> import requests
>>> r = requests.get('https://api.openweathermap.org/data/2.5/weather?zip=11953,US&appid=YOUR-KEY-HERE')
|
Python has a nice JSON parser built in that will give you a dictionary (arbitrary-key indexed array).
Once converted/parsed, you can traverse the JSON path by name.
For example, if you want to get the description of the current weather, run:
>>> j = r.json() >>> j['weather'][0]['description'] 'mist' |
For some reason, the temperature is in Kelvin, but you can easily convert it to celsius:
>>> j['main']['temp'] - 273.15 6.33 |
Note: If you add "&units=metric" to your request, you'll get back temperature in celsius, or "&units=imperial" for Fahrenheit.
Celsius:
https://api.openweathermap.org/data/2.5/weather?lat=57&lon=-2.15&appid={API key}&units=metric

Fahrenheit:
https://api.openweathermap.org/data/2.5/weather?lat=57&lon=-2.15&appid={API key}&units=imperial
Our only complaint is that the time is in UTC seconds:
>>> j['dt'] 1551050040 |
Which is annoying if you have a device that doesn't have a battery backup real-time clock (why should you when you have Internet?).
So we like to use a separate API called WorldTimeAPI to get the UNIX time in the current time zone. This API is nifty in that it will use your public facing IP address to geolocate your time zone - no API key required:
>>> r = requests.get('http://worldtimeapi.org/api/ip')
>>> r.json()['datetime']
'2019-02-24T18:45:12.977139-05:00'
|
Once you have that data in plain text format, you can craft a display, using a simple character LCD or a color TFT.
For our little single-serving device we made, we added a 2600 van as the background image, so we can at a glance see the weather in Middle Island, New York.
Good night and good luck.